Performance and Benchmark
Benchmarks Datasets
- Boston House Prices Dataset
- Iris Dataset
- Red Wine Quality Dataset
- White Wine Quality Dataset
- Breast Cancer Wisconsin Diagnostic Dataset
Benchmark Environment
- OS Version: Ubuntu 22.04 LTS
- CPU Architecture : arm64 M1
- Python Version: 3.11
Libraries Versions:
- distfit: 1.6.11
- matplotlib: 3.8.0
- numpy: 1.26.0
- pandas: 2.1.0
- scikit-learn: 1.3.0
Python Script: The code well-aligned with the Boston House Prices Dataset benchmark using AdaptiveBridge and LinearRegression. The other benchmarks will load different model and dataset.
import pandas as pd
from sklearn.model_selection import train_test_split
from sklearn.preprocessing import MinMaxScaler
from sklearn.linear_model import LinearRegression
from adaptivebridge import AdaptiveBridge

# Load Boston House Prices Dataset
df = pd.read_csv('data/boston_housing_prices.csv', header=0, sep=',')
y_name = 'medv'  # Target column name
df = df.dropna()

# Split features from target
x_df = df.drop([y_name], axis=1)
y_df = df[y_name]

# Split the dataset into training and testing sets; test set will be 15% of the total dataset
x_train, x_test, y_train, y_test = train_test_split(x_df, y_df, test_size=0.15, random_state=42)

# Activate AdaptiveBridge model based on LinearRegression with default values
adaptive_bridge = AdaptiveBridge(LinearRegression())

# Train (Fit) AdaptiveBridge to the data without feature engineering
adaptive_bridge.fit(x_train, y_train)

# Print the AdaptiveBridge feature sequence and table
print("Feature Sequence:\n", adaptive_bridge.feature_sequence())
print("Feature Table:\n", adaptive_bridge.feature_table())

# Run benchmark on the test dataset to check accuracy and fit
benchmark_score = adaptive_bridge.benchmark(x_test, y_test)
print("Benchmark Score:", benchmark_score)
Results
The primary objective of our benchmark is to demonstrate that AdaptiveBridge can effectively bridge the gap caused by missing features and data. However, it's important to note that this improvement in data completeness comes at the cost of performance. AdaptiveBridge is designed to address practical production problems rather than theoretical research challenges.
The benchmarks presented below utilize models that may not necessarily be the optimal choice for the specific database type (such as Linear versus Logistic models). Initial accuracy figures are not relevant because essential processes like feature engineering, feature scaling, data cleanup, and outlier removal have not been performed.
Additionally, it's crucial to consider the impact of using train_test_split to divide the dataset into training and testing sets. Statistically, reproducing identical results for the same dataset becomes considerably challenging due to this split method
Boston House Prices Dataset
- Model: Default LinearRegression()
- Model Parameters: None
- AdaptiveBridge Parameters: Default
- Number of Features: 12
- Fit Duraction: 20.7s
Feature Sequence Dependencies:
User-defined feature-engineering features: (Must be provided by the user)
 - None

Mandatory: (Must be provided by the user)
 - None

Data Distribution Method: (data distribution method will be used and not prediction)
 - Feature crim, ['beta', 'median', 0.24312499999999998]
 - Feature zn, ['pareto', 'median', 0.0]
 - Feature chas, ['discrete', 'median', 0]
 - Feature rad, ['discrete', 'median', 5]
 - Feature b, ['beta', 'mean', 359.9163023255814]

Prediction by Adaptive Model: (will be predict by adaptiv model)
 - Feature ptratio, Dependencies: ['zn', 'rad']
 - Feature rm, Dependencies: ['zn', 'ptratio']
 - Feature nox, Dependencies: ['crim', 'zn', 'rm', 'rad', 'b']
 - Feature tax, Dependencies: ['crim', 'zn', 'nox', 'rm', 'rad', 'ptratio', 'b']
 - Feature dis, Dependencies: ['crim', 'zn', 'nox', 'rad', 'tax', 'b']
 - Feature lstat, Dependencies: ['crim', 'zn', 'nox', 'rm', 'dis', 'rad', 'ptratio', 'b']
 - Feature indus, Dependencies: ['zn', 'nox', 'rm', 'dis', 'tax', 'ptratio', 'b', 'lstat']
 - Feature age, Dependencies: ['crim', 'indus', 'nox', 'dis', 'rad', 'ptratio', 'b', 'lstat']

Explanation: The results presented reveal that the AdaptiveBridge Adaptive model has the capability to handle all features within its scope. None of these features were designated as mandatory, which implies that as long as at least one feature value is provided, the adaptive model can effectively make predictions and furnish them to the user.
AdaptiveBridge Performance Matrix:
Non-AdaptiveBridge Model Accuracy in %: **0.7917835776631301**

This shows the performance of AdaptiveBridge, the average accuracy for every number of features missing:
Average AdaptiveBridge accuracy in % with 1 missing features: **0.7836536074005985**
Average AdaptiveBridge accuracy in % with 2 missing features: **0.7779702423922812**
Average AdaptiveBridge accuracy in % with 3 missing features: **0.7739865208421037**
Average AdaptiveBridge accuracy in % with 4 missing features: **0.770672263793981**
Average AdaptiveBridge accuracy in % with 5 missing features: **0.7668064812520304**
Average AdaptiveBridge accuracy in % with 6 missing features: **0.7610805318016617**
Average AdaptiveBridge accuracy in % with 7 missing features: **0.7521942666991065**
Average AdaptiveBridge accuracy in % with 8 missing features: **0.7389524904341405**
Average AdaptiveBridge accuracy in % with 9 missing features: **0.7203338609927032**
Average AdaptiveBridge accuracy in % with 10 missing features: **0.6954964226869044**
Average AdaptiveBridge accuracy in % with 11 missing features: **0.6637259559697675**
Average AdaptiveBridge accuracy in % with 12 missing features: **0.6244068118496848**

Explanation: The presented results indicate that the AdaptiveBridge Adaptive model experiences an average accuracy decrease of 0.8% when one feature is missing. This benchmark calculation was performed for each instance of a single feature being absent, and the resulting accuracies were then averaged.
Similarly, the same calculation was conducted for cases involving two, three, four, and so on, missing features. It's essential to note that this analysis excludes features designated as mandatory or user-defined (as a part of feature engineering) since users are required to provide values for them. In the Boston dataset mentioned above, none of the features were set as mandatory, allowing for the possibility of up to 12 features being missing.
Iris Dataset
- Model: Default RandomForestRegressor()
- Model Parameters: None
- AdaptiveBridge Parameters: Default
- Number of Features: 4
- Fit Duraction: 0.6s
Feature Sequence Dependencies:
User-defined feature-engineering features: (Must be provided by the user)
 - None

Mandatory: (Must be provided by the user)
 - Feature PetalWidthCm

Data Distribution Method: (data distribution method will be used and not prediction)
 - None

Prediction by Adaptive Model: (will be predict by adaptiv model)
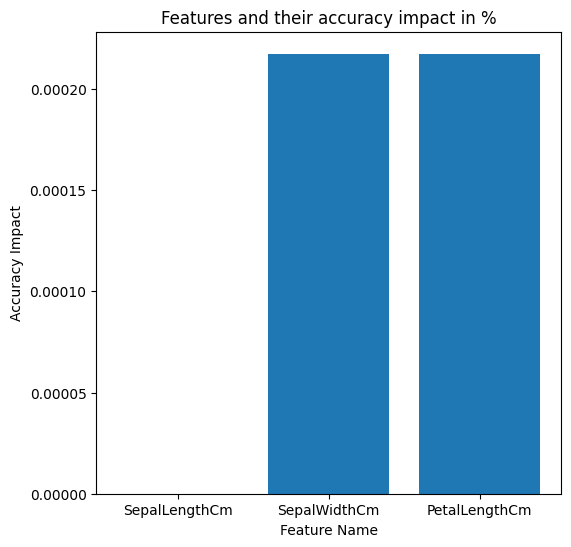
 - Feature SepalLengthCm, Dependencies: ['PetalWidthCm']
 - Feature SepalWidthCm, Dependencies: ['PetalWidthCm']
 - Feature PetalLengthCm, Dependencies: ['SepalWidthCm', 'PetalWidthCm']

AdaptiveBridge Performance Matrix:
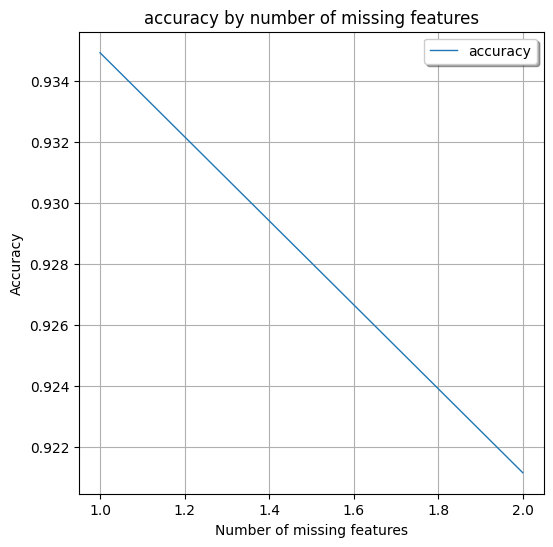
Non-AdaptiveBridge Model Accuracy in %: **0.9347826086956522**

This shows the performance of AdaptiveBridge, the average accuracy for every number of features missing:
Average AdaptiveBridge accuracy in % with 1 missing features: **0.9349275362318842**
Average AdaptiveBridge accuracy in % with 2 missing features: **0.9211594202898551**

Red Wine Quality Dataset
- Model: Default Ridge()
- Model Parameters: None
- AdaptiveBridge Parameters: Default
- Number of Features: 11
- Fit Duraction: 1.1s
Feature Sequence Dependencies:
User-defined feature-engineering features: (Must be provided by the user)
 - None

Mandatory: (Must be provided by the user)
 - Feature alcohol
 - Feature pH

Data Distribution Method: (data distribution method will be used and not prediction)
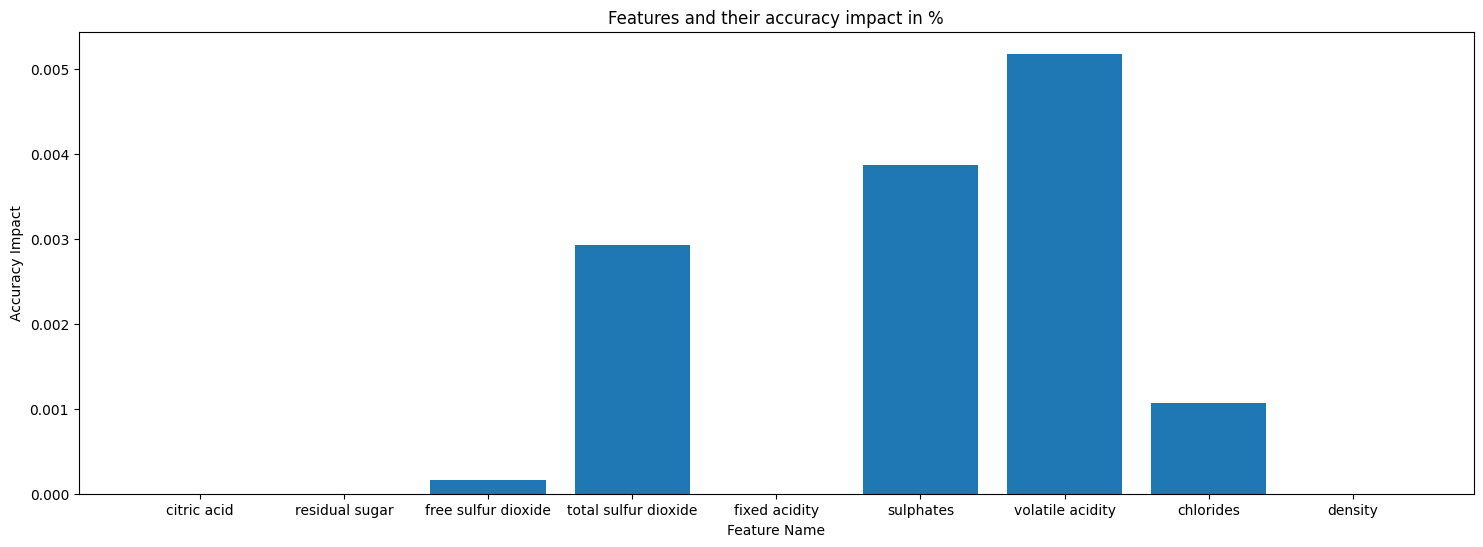
 - Feature citric acid, ['discrete', 'median', 0.26]
 - Feature residual sugar, ['genextreme', 'mode', 2.0]
 - Feature free sulfur dioxide, ['gamma', 'median', 14.0]
 - Feature total sulfur dioxide, ['beta', 'median', 38.0]

Prediction by Adaptive Model: (will be predict by adaptiv model)
 - Feature fixed acidity, Dependencies: ['citric acid']
 - Feature sulphates, Dependencies: ['citric acid']
 - Feature volatile acidity, Dependencies: ['fixed acidity', 'citric acid']
 - Feature chlorides, Dependencies: ['sulphates']
 - Feature density, Dependencies: ['citric acid', 'residual sugar', 'pH', 'alcohol']

AdaptiveBridge Performance Matrix:
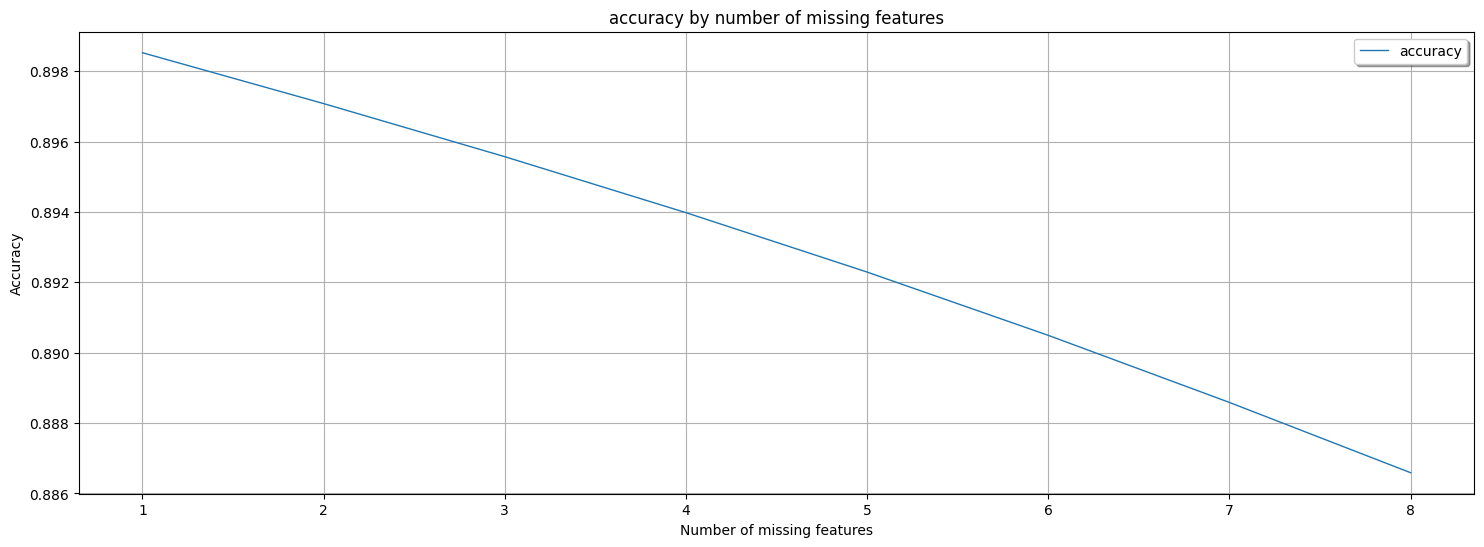
Non-AdaptiveBridge Model Accuracy in %: **0.8999241048297895**

This shows the performance of AdaptiveBridge, the average accuracy for every number of features missing:
Average AdaptiveBridge accuracy in % with 1 missing features: **0.89852452273704**
Average AdaptiveBridge accuracy in % with 2 missing features: **0.8970789861014118**
Average AdaptiveBridge accuracy in % with 3 missing features: **0.8955704693977624**
Average AdaptiveBridge accuracy in % with 4 missing features: **0.8939804368062005**
Average AdaptiveBridge accuracy in % with 5 missing features: **0.8922916094583999**
Average AdaptiveBridge accuracy in % with 6 missing features: **0.890493262777842**
Average AdaptiveBridge accuracy in % with 7 missing features: **0.8885868798320217**
Average AdaptiveBridge accuracy in % with 8 missing features: **0.8865898996165795**

White Wine Quality Dataset
- Model: Default ElasticNet()
- Model Parameters: None
- AdaptiveBridge Parameters: Default
- Number of Features: 11
- Fit Duraction: 5.0s
Feature Sequence Dependencies:
User-defined feature-engineering features: (Must be provided by the user)
 - None

Mandatory: (Must be provided by the user)
 - None

Data Distribution Method: (data distribution method will be used and not prediction)
 - Feature volatile acidity, ['discrete', 'median', 0.26]
 - Feature citric acid, ['discrete', 'median', 0.32]
 - Feature residual sugar, ['pareto', 'median', 5.1]
 - Feature pH, ['discrete', 'median', 3.18]
 - Feature sulphates, ['discrete', 'median', 0.48]

Prediction by Adaptive Model: (will be predict by adaptiv model)
 - Feature alcohol, Dependencies: ['residual sugar']
 - Feature fixed acidity, Dependencies: ['citric acid', 'pH']
 - Feature total sulfur dioxide, Dependencies: ['residual sugar', 'alcohol']
 - Feature chlorides, Dependencies: ['alcohol']
 - Feature free sulfur dioxide, Dependencies: ['residual sugar', 'total sulfur dioxide', 'alcohol']
 - Feature density, Dependencies: ['residual sugar', 'chlorides', 'free sulfur dioxide', 'total sulfur dioxide', 'alcohol']

AdaptiveBridge Performance Matrix:
Non-AdaptiveBridge Model Accuracy in %: **0.8840083420188398**

This shows the performance of AdaptiveBridge, the average accuracy for every number of features missing:
Average AdaptiveBridge accuracy in % with 1 missing features: **0.8839940381275283**
Average AdaptiveBridge accuracy in % with 2 missing features: **0.8839205157197451**
Average AdaptiveBridge accuracy in % with 3 missing features: **0.88379118083091**
Average AdaptiveBridge accuracy in % with 4 missing features: **0.883610683410401**
Average AdaptiveBridge accuracy in % with 5 missing features: **0.883384917321556**
Average AdaptiveBridge accuracy in % with 6 missing features: **0.8831210203416705**
Average AdaptiveBridge accuracy in % with 7 missing features: **0.8828273741619942**
Average AdaptiveBridge accuracy in % with 8 missing features: **0.882513604387736**
Average AdaptiveBridge accuracy in % with 9 missing features: **0.8821905805380693**
Average AdaptiveBridge accuracy in % with 10 missing features: **0.8818704160461195**

Breast Cancer Wisconsin Diagnostic Dataset
- Model: Default RandomForestRegressor()
- Model Parameters: None
- AdaptiveBridge Parameters: correlation_threshold=0.85, importance_threshold=0.05 Changed due to high CPU utilization and long training time
- Number of Features: 30
- Fit Duraction: 5.7s
Feature Sequence Dependencies:
User-defined feature-engineering features: (Must be provided by the user)
 - None

Mandatory: (Must be provided by the user)
 - Feature perimeter_worst
 - Feature area_worst

Data Distribution Method: (data distribution method will be used and not prediction)
 - Feature texture_mean, ['lognorm', 'median', 18.83]
 - Feature smoothness_mean, ['discrete', 'median', 0.09514]
 - Feature symmetry_mean, ['discrete', 'median', 0.1793]
 - Feature fractal_dimension_mean, ['discrete', 'median', 0.06149]
 - Feature texture_se, ['discrete', 'median', 1.13]
 - Feature smoothness_se, ['discrete', 'median', 0.006369]
 - Feature compactness_se, ['discrete', 'median', 0.02062]
 - Feature concavity_se, ['discrete', 'median', 0.02595]
 - Feature concave points_se, ['discrete', 'median', 0.01103]
 - Feature symmetry_se, ['discrete', 'median', 0.01873]
 - Feature fractal_dimension_se, ['discrete', 'median', 0.003224]
 - Feature texture_worst, ['beta', 'median', 25.27]
 - Feature smoothness_worst, ['discrete', 'median', 0.1313]
 - Feature symmetry_worst, ['discrete', 'median', 0.2826]
 - Feature fractal_dimension_worst, ['discrete', 'median', 0.08004]
 - Feature compactness_worst, ['discrete', 'median', 0.2101]
 - Feature area_se, ['genextreme', 'mode', 16.97]
 - Feature area_mean, ['lognorm', 'median', 559.2]
 - Feature perimeter_mean, ['genextreme', 'mode', 82.61]

Prediction by Adaptive Model: (will be predict by adaptiv model)
 - Feature compactness_mean, Dependencies: ['compactness_worst']
 - Feature concavity_worst, Dependencies: ['compactness_worst']
 - Feature concavity_mean, Dependencies: ['compactness_mean', 'concavity_worst']
 - Feature concave points_worst, Dependencies: ['concavity_mean', 'concavity_worst']
 - Feature concave points_mean, Dependencies: ['concavity_mean', 'concave points_worst']
 - Feature radius_se, Dependencies: ['area_se']
 - Feature perimeter_se, Dependencies: ['radius_se']
 - Feature radius_worst, Dependencies: ['perimeter_mean', 'area_mean', 'perimeter_worst', 'area_worst']
 - Feature radius_mean, Dependencies: ['area_mean', 'radius_worst', 'perimeter_worst', 'area_worst']

Explanation: The presented results highlight that the AdaptiveBridge Adaptive model designates two features as mandatory, namely perimeter_worst and area_worst. This designation signifies that as long as values for these specific features are provided, the adaptive model can proficiently generate predictions and complete the prediction process for any remaining missing features.
AdaptiveBridge Performance Matrix:
Non-AdaptiveBridge Model Accuracy in %: **0.9072574178027265**

This shows the performance of AdaptiveBridge, the average accuracy for every number of features missing:
Average AdaptiveBridge accuracy in % with 1 missing features: **0.9002714522979247**
Average AdaptiveBridge accuracy in % with 2 missing features: **0.8938451077907089**
Average AdaptiveBridge accuracy in % with 3 missing features: **0.8892630941206685**
Average AdaptiveBridge accuracy in % with 4 missing features: **0.8788332233859213**
Average AdaptiveBridge accuracy in % with 5 missing features: **0.8747428523426751**
Average AdaptiveBridge accuracy in % with 6 missing features: **0.8713123511689101**
Average AdaptiveBridge accuracy in % with 7 missing features: **0.8669112776423517**
Average AdaptiveBridge accuracy in % with 8 missing features: **0.8637995023398635**
Average AdaptiveBridge accuracy in % with 9 missing features: **0.8571347680397212**
Average AdaptiveBridge accuracy in % with 10 missing features: **0.8535726477516224**
Average AdaptiveBridge accuracy in % with 11 missing features: **0.8496700447785884**
Average AdaptiveBridge accuracy in % with 12 missing features: **0.8462292668989493**
Average AdaptiveBridge accuracy in % with 13 missing features: **0.8452630941206685**
Average AdaptiveBridge accuracy in % with 14 missing features: **0.8431958162996332**
Average AdaptiveBridge accuracy in % with 15 missing features: **0.8405121215973477**
Average AdaptiveBridge accuracy in % with 16 missing features: **0.8388349740520229**
Average AdaptiveBridge accuracy in % with 17 missing features: **0.8371875735292501**
Average AdaptiveBridge accuracy in % with 18 missing features: **0.8358669885120639**
Average AdaptiveBridge accuracy in % with 19 missing features: **0.8335050352262703**
Average AdaptiveBridge accuracy in % with 20 missing features: **0.8319901285920722**
Average AdaptiveBridge accuracy in % with 21 missing features: **0.8306005607603338**
Average AdaptiveBridge accuracy in % with 22 missing features: **0.829106460435239**
Average AdaptiveBridge accuracy in % with 23 missing features: **0.8269835092168991**
Average AdaptiveBridge accuracy in % with 24 missing features: **0.8246713565122725**
Average AdaptiveBridge accuracy in % with 25 missing features: **0.8243314030417173**
Average AdaptiveBridge accuracy in % with 26 missing features: **0.8240143727860272**
Average AdaptiveBridge accuracy in % with 27 missing features: **0.8219242715441056**
Average AdaptiveBridge accuracy in % with 28 missing features: **0.820920352262714**
