Methods and Parameters
Parameters
model
The model parameter is in accordance with what was previously mentioned in the Initialization section.
correlation_threshold
The correlation_threshold parameter needs to be set by the user (default=0.25). This parameter, when set in AdaptiveBridge, serves as the threshold for decision-making in model selection. A higher threshold implies that more features will not be used by the Data Distribution method when the Adaptive model is unable to predict, making more features mandatory.
Conversely, a lower threshold impacts the fitting performance but decreases the cases where features become mandatory.
min_accuracy
The min_accuracy is a parameter that needs to be set by the user (default=0.5). It establishes the minimum accuracy required for the Adaptive model's prediction to consider a feature (if missing). If a model cannot predict a feature with higher accuracy than the min_accuracy, it will be designated as mandatory.
Higher values for min_accuracy lead to more mandatory features that cannot be missing. It's essential to note that min_accuracy is not the overall accuracy provided by AdaptiveBridge but a decision parameter only. You can use the benchmark method to evaluate general accuracy.
default_accuracy_selection
The default_accuracy_selection is another parameter to be set by the user (default=0.95). It sets the threshold for acceptable accuracy of the Adaptive model's prediction for a feature (if missing). When a model achieves accuracy equal to or higher than default_accuracy_selection, it will halt the fitting process for that feature.
A lower default_accuracy_selection reduces training time.
importance_threshold
The importance_threshold is a parameter that needs to be set by the user (default=0.1). This parameter dictates the threshold for AdaptiveBridge regarding feature sequence dependencies. A higher importance_threshold designates more features as mandatory, indicating that these features are crucial, and using the Data Distribution method is insufficient.
accuracy_logic
The accuracy_logic parameter is optional and can be set by the user (default=None). When set to None, AdaptiveBridge uses the default accuracy method, which is Mean Absolute Percentage Error. However, AdaptiveBridge offers flexibility through custom accuracy calculation logic (accuracy_logic). This user-defined accuracy logic impacts various calculations and algorithms within AdaptiveBridge, including feature selection and the accuracy of the Adaptive model when using the benchmark method.
You can define a custom function to calculate prediction accuracy, such as mean_squared_error, r2_score, or mean_absolute_percentage_error from sklearn. Note that mean_absolute_percentage_error and mean_squared_error require adjustments to (1 - mean_absolute_percentage_error) to function correctly. It is recommended to use r2_score or None.
Here's an example of implementing custom logic:
# Example 1: Feature selection and model fitting
adaptive_bridge = AdaptiveBridge(model=LinearRegression())
adaptive_bridge.fit(x_train, y_train)

# Example 2: Making predictions with the fitted model
predictions = adaptive_bridge.predict(x_test)

# Example 3: Custom accuracy logic
def custom_accuracy(y_true, y_pred):
    # Define your custom accuracy calculation here with the result as % error
    return result

adaptive_bridge = AdaptiveBridge(model=LinearRegression(), accuracy_logic=custom_accuracy)
adaptive_bridge.fit(x_train, y_train)
predictions = adaptive_bridge.predict(x_test)
Methods
Fitting AdaptiveBridge Adaptive Model
After initialization, you can fit the adaptive model to your data using the fit method. Provide the feature data frame (x_df) and the target variable data (y_df) as parameters.
# Fit the model
adaptive_bridge.fit(x_df, y_df)
Making Predictions
Once the model is fitted, predictions can be made using the .predict method. Provide the feature data frame for prediction (x_df) as a parameter.
# Make predictions
predictions = adaptive_bridge.predict(x_df)
Complete and Bridge a DataFrame
Although part of the prediction process, you can choose only to predict missing values and features in a dataset and obtain a completely new data frame (dataset) without missing values using the .bridge method. Provide the feature data frame to complete (x_df) as a parameter.
# Complete data frame (dataset)
complete_x_df = adaptive_bridge.bridge(x_df)
Feature Importance
The importance of features can be assessed using the feature_importance_score method, which summarizes the feature importance scores.
adaptive_bridge.feature_importance_score()
Output Example:
Feature: crim (0), Score: 0.39030
Feature: zn (1), Score: 0.52751
Feature: indus (2), Score: 0.22896
Feature: chas (3), Score: 0.18584
Feature: nox (4), Score: 9.85505
Feature: rm (5), Score: 23.94361
Feature: age (6), Score: 0.04747
Feature: dis (7), Score: 5.59984
Feature: rad (8), Score: 2.92259
Feature: tax (9), Score: 5.03544
Feature: ptratio (10), Score: 17.58346
Feature: b (11), Score: 3.32124
Feature: lstat (12), Score: 6.63980
The above example shows the feature's importance not in percentage but by absolute value. In our example, Feature rm (5) is providing an absolute value of 23.94 to the prediction target.
Feature Sequence Dependencies
Feature Sequence Selection is a crucial aspect of AdaptiveBridge. It automatically identifies mandatory features and methods to handle deviations in data distribution, and creates predictive models for features. The process involves the following steps:
- Identifying mandatory and deviation features.
- Performing feature sequence based on dependencies.
Feature Sequence Dependencies can be displayed by the feature_sequence method that will print the features sequence, dependencies, and their handling methods.
adaptive_bridge.feature_sequence()
Output Example:
Feature Sequence Dependencies:
User-defined feature-engineering features: (Must be provided by the user)
 - None

Mandatory: (Must be provided by the user)
 - Feature crim
 - Feature zn

Data Distribution Method: (data distribution method will be used and not prediction)
 - Feature chas, 0

Prediction by Adaptive Model: (will be predicted by the adaptive model)
 - Feature rm, Dependencies: ['zn']
 - Feature ptratio, Dependencies: ['crim', 'zn', 'rm']
 - Feature nox, Dependencies: ['crim', 'zn', 'rm']
 - Feature b, Dependencies: ['crim', 'nox']
 - Feature tax, Dependencies: ['crim', 'zn', 'nox', 'ptratio', 'b']
 - Feature age, Dependencies: ['crim', 'zn', 'nox', 'tax', 'b']
 - Feature dis, Dependencies: ['crim', 'zn', 'nox', 'age', 'tax', 'b']
 - Feature indus, Dependencies: ['crim', 'zn', 'nox', 'rm', 'dis', 'tax', 'b']
 - Feature lstat, Dependencies: ['crim', 'zn', 'industry', 'rm', 'age', 'tax', 'b']
 - Feature rad, Dependencies: ['crim', 'zn', 'industry', 'nox', 'age', 'tax', 'ptratio', 'b']
The above example shows the features crim and zn are mandatory, meaning they must be provided to predict the target. The example also shows that the feature chas will be completed and predicted using one of the data distribution methods. This means the feature will be given a value (when missing) based on the data distribution. In the example case, it gets 0 because this feature is Boolean and the mean is below 0.5. The above example shows the rest of the features and their dependency structure and sequence, in general, it shows how each feature is dependent on other features. The list is sorted by the sequence. You can see that feature rm will be used for feature zn in the adaptive model and will be predicted. Feature ptratio will use more features, including rm, which is why it will be the second feature predicted in case both features rm and ptratio are missing. You can also see that User-defined feature-engineering is None because no feature was declared.
Benchmark
Benchmarking is a crucial step for AdaptiveBridge. This method allows you to evaluate every aspect of AdaptiveBridge's structure, performance, and accuracy.
adaptive_bridge.benchmark(x_test_df, y_test_df)
Here is some key information that the benchmark provides:
Non-AdaptiveBridge Model Accuracy: This shows the non-AdaptiveBridge model accuracy.
Non-AdaptiveBridge Model Accuracy: 0.8999241048297895`
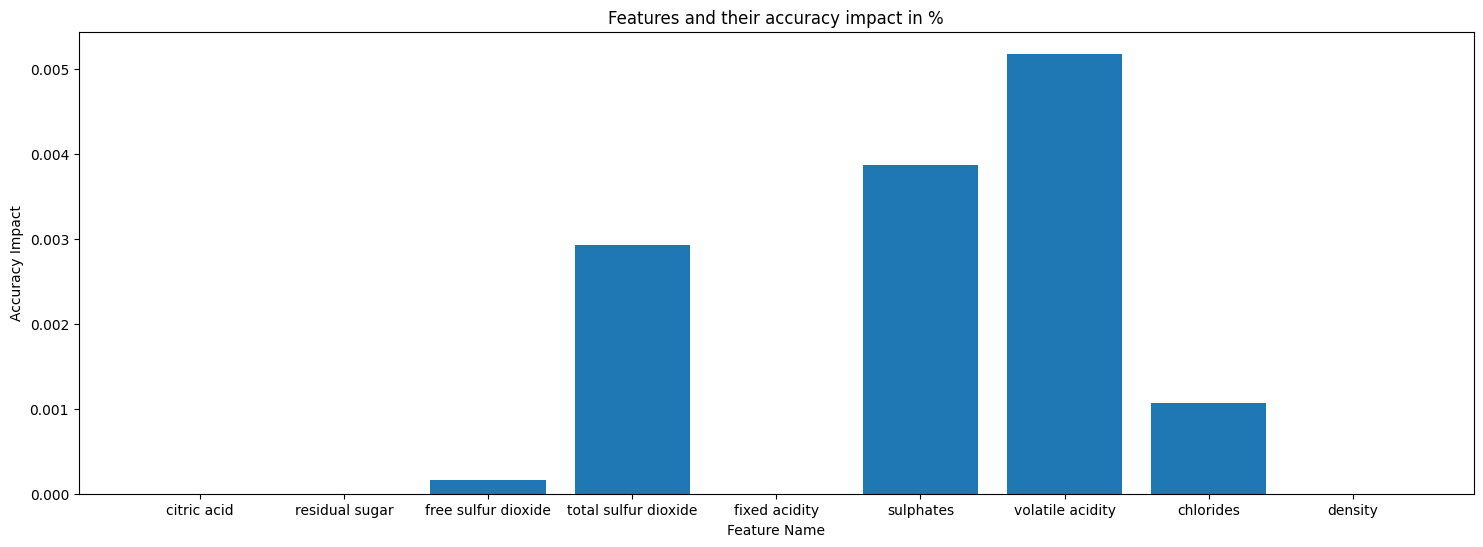
AdaptiveBridge Features Accuracy Impact: This shows the impact of each feature when it's missing.
AdaptiveBridge Performance Matrix: This shows the performance of AdaptiveBridge, the average accuracy for every number of features missing. This will include a plot that shows how the accuracy is dropping.
AdaptiveBridge performance matrix:
This shows the performance of AdaptiveBridge, the average accuracy for every number of features missing.
---
Average AdaptiveBridge accuracy with 1 missing features: 0.8985245227370400
Average AdaptiveBridge accuracy with 2 missing features: 0.8970789861014118
Average AdaptiveBridge accuracy with 3 missing features: 0.8955704693977624
Average AdaptiveBridge accuracy with 4 missing features: 0.8939804368062005
Average AdaptiveBridge accuracy with 5 missing features: 0.8922916094583999
Average AdaptiveBridge accuracy with 6 missing features: 0.890493262777842
Average AdaptiveBridge accuracy with 7 missing features: 0.8885868798320217
Average AdaptiveBridge accuracy with 8 missing features: 0.8865898996165795
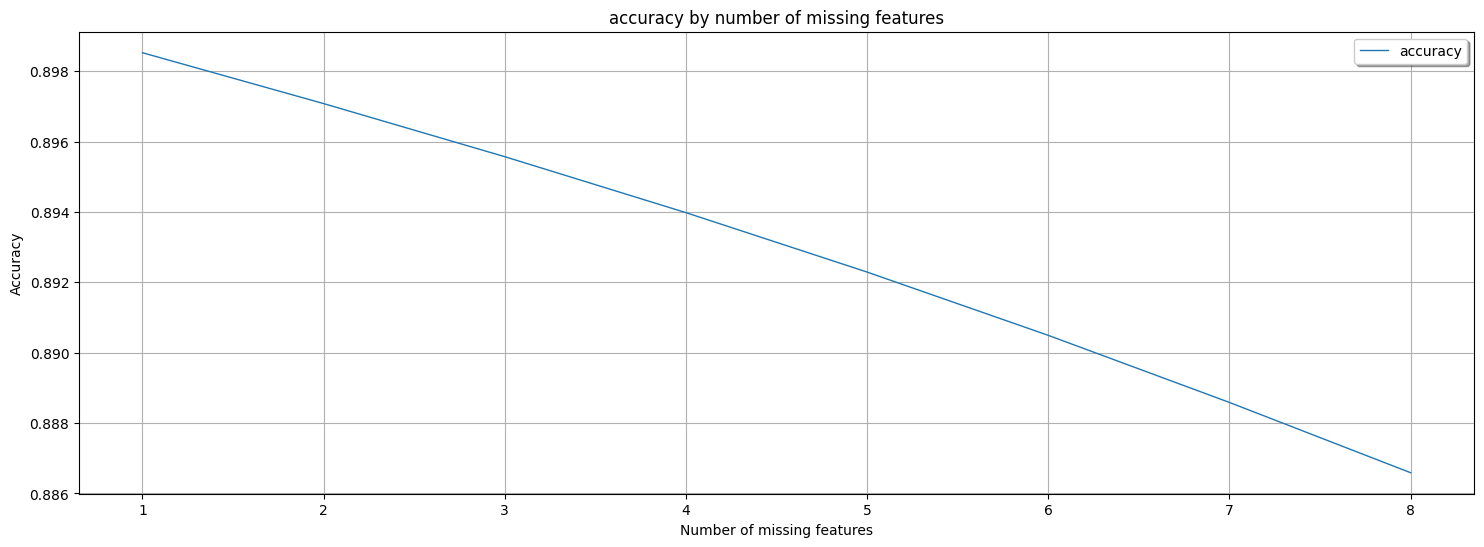
The performance of AdaptiveBridge should be according to the AdaptiveBridge Performance Matrix ONLY.